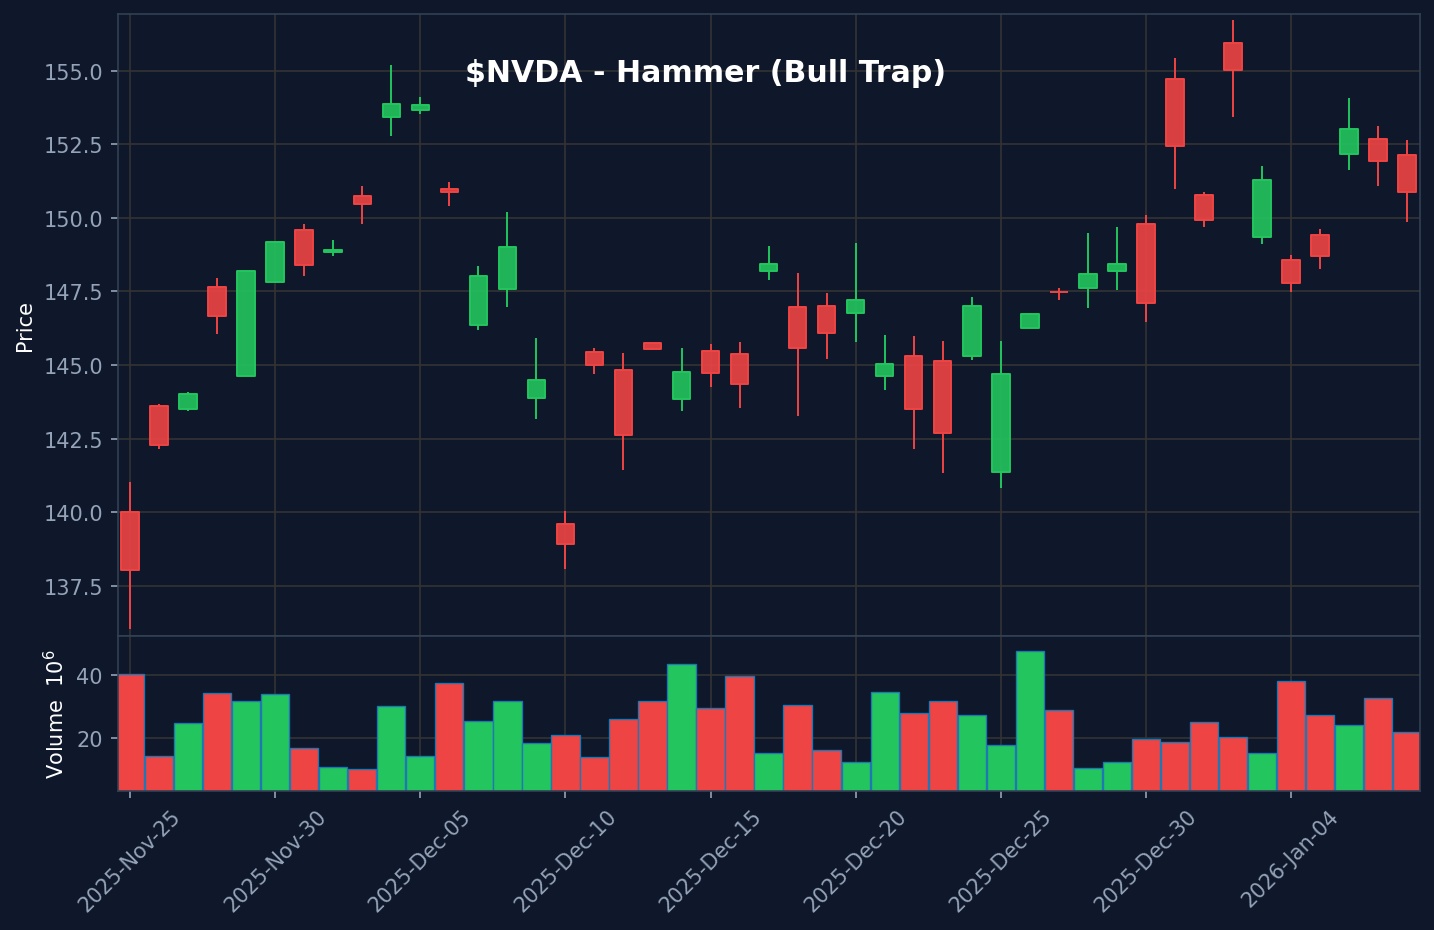
Trading patterns can be deceiving. This Hammer on $TSLA looked like a textbook buy signal, but it turned into a costly lesson for many traders.
What is a Hammer?
A Hammer is a single-candle reversal pattern with a small body and long lower wick, signaling potential buying pressure after a decline.
Key characteristics:
- Small body near the top of the range
- Long lower wick (at least 2x the body)
- Little or no upper wick
For a detailed definition, see Investopedia's guide.
What Happened
The chart showed a clean Hammer forming at what appeared to be a key support level. The pattern structure was textbook-perfect - small body, long lower wick, minimal upper shadow. Many traders saw this as a clear buy opportunity.
The Warning Signs
Several red flags were present that smart traders would have noticed:
- Bearish trend: The broader trend was down - this was a counter-trend setup
- Weak volume: Volume didn't confirm the reversal signal
- Market context: Overall market sentiment was risk-off
- No follow-through: Price failed to push higher the next session
The Lesson
Patterns are clues, not commands. When the trend is bearish and volume doesn't confirm, a Hammer can become a bull trap. Pattern recognition alone isn't enough - context determines whether a setup is tradeable.
How to Apply This
Before trading any reversal pattern, run through this checklist:
- Trend: With you or against you?
- Volume: Confirming or weak?
- Location: At real support with room to run?
- Invalidation: Where's your stop if wrong?
Trading is about probabilities, not certainties. The best traders don't win every trade - they avoid the bad ones and let the good ones run.
Ready to practice? Start your daily training and level up your pattern recognition skills.