Market Structure: The Rhythm Every Market Follows
Markets look chaotic until you see the structure. Once you understand how markets move—the rhythm of impulse and pullback, the sequence of highs and lows—you'll never unsee it.
The Two Phases of Every Market
Markets move in two alternating phases:
Impulse
- The main move
- Strong, directional, full of momentum
- Large candle bodies, small wicks
- Creates structure (new highs or new lows)
Pullback (Correction)
- Counter-move to the impulse
- Smaller, choppier, less conviction
- Tests the structure impulse created
- Often retraces 38%-78% of impulse
Understanding which phase you're in changes everything about how you trade.
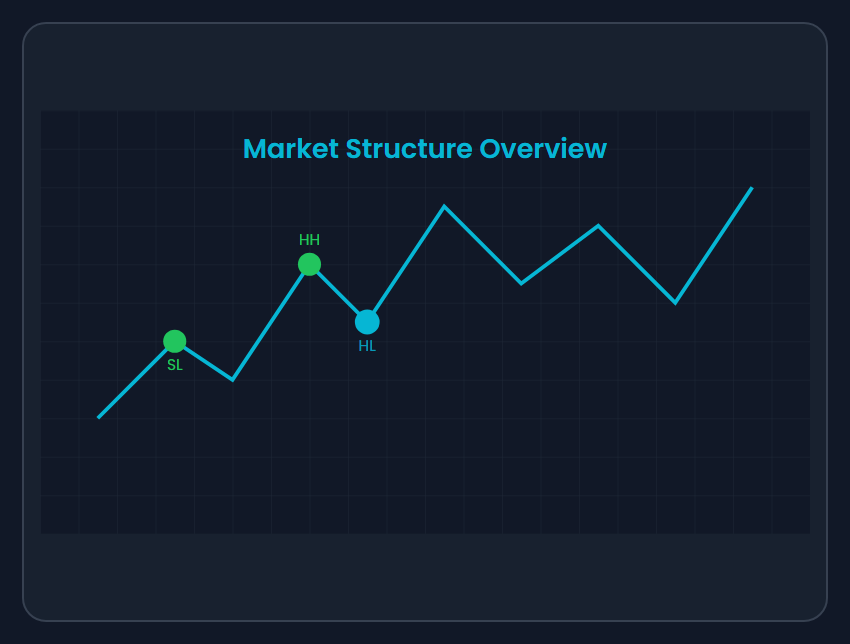
Uptrend Structure: HH and HL
In an uptrend, price makes:
- Higher Highs (HH): Each peak exceeds the previous peak
- Higher Lows (HL): Each trough stays above the previous trough
The rhythm: HH → HL → HH → HL → HH
What it means: Buyers are in control. Each pullback attracts more buyers at higher prices. Each impulse pushes to new territory.
How to trade it: Trade WITH the uptrend. Look for long entries at Higher Lows. Don't short—you're fighting the dominant force.
Downtrend Structure: LL and LH
In a downtrend, price makes:
- Lower Lows (LL): Each trough breaks below the previous trough
- Lower Highs (LH): Each peak fails to reach the previous peak
The rhythm: LL → LH → LL → LH → LL
What it means: Sellers are in control. Each bounce is sold into. Each impulse pushes to new lows.
How to trade it: Trade WITH the downtrend. Look for short entries at Lower Highs. Don't try to catch the falling knife.
Break of Structure (BOS)
Break of Structure confirms the trend continues.
Bullish BOS
Price breaks above the previous Higher High.
- Confirms buyers still in control
- Uptrend continues
- Look for longs at next pullback (new HL)
Bearish BOS
Price breaks below the previous Lower Low.
- Confirms sellers still in control
- Downtrend continues
- Look for shorts at next pullback (new LH)
Critical rule: Confirm on candle CLOSE. A wick through doesn't count. Bodies through levels matter.
Change of Character (CHoCH)
Change of Character signals potential reversal. It's the first warning that the dominant side may be losing control.
Bullish CHoCH (in a downtrend)
Price breaks ABOVE the previous Lower High.
- Downtrend structure violated
- Sellers couldn't make a new Lower Low
- Watch for potential uptrend developing
Bearish CHoCH (in an uptrend)
Price breaks BELOW the previous Higher Low.
- Uptrend structure violated
- Buyers couldn't defend the HL
- Watch for potential downtrend developing
Important: CHoCH doesn't guarantee reversal. It's the first signal, not the final confirmation. Wait for new structure to form in the opposite direction.
BOS vs CHoCH: The Key Difference
| | BOS | CHoCH | |---|-----|-------| | Meaning | Trend continues | Trend may reverse | | In uptrend | Breaks above HH | Breaks below HL | | In downtrend | Breaks below LL | Breaks above LH | | Trading action | Continue trading with trend | Start looking for trades in new direction |
How to Mark Structure
Step 1: Identify the trend
Zoom out. Is the overall direction up, down, or sideways?
Step 2: Mark swing points
- Mark significant peaks (potential HH or LH)
- Mark significant troughs (potential HL or LL)
Step 3: Label the structure
- In uptrend: Label HH and HL
- In downtrend: Label LL and LH
Step 4: Watch for BOS or CHoCH
- BOS continues your bias
- CHoCH alerts you to potential change
Tip: Use different colors. Green for HH/HL, red for LH/LL. Blue lines for BOS, yellow for CHoCH.
Real-World Structure Reading
Scenario 1: Clean uptrend Daily chart shows: HL → HH → HL → HH (repeated)
- Bias: Bullish
- Strategy: Look for long entries at pullbacks to HL areas
- Watch for: Break below most recent HL (would be CHoCH)
Scenario 2: CHoCH appears That uptrend suddenly breaks below the HL.
- First warning: Bullish CHoCH
- Action: Stop looking for longs
- Next step: Watch for LL → LH to confirm reversal
Scenario 3: Reversal confirmed After CHoCH, price makes LL, then LH, then new LL (BOS).
- Confirmation: New downtrend established
- Strategy: Now look for shorts at LH areas
Multi-Timeframe Structure
Structure exists on every timeframe. Higher timeframes dominate.
The Hierarchy:
- Daily/Weekly: Major structure (most significant)
- 4H: Intermediate structure
- 1H: Minor structure
- 15M: Entry structure
Best practice:
- Identify HTF trend for direction
- Mark MTF structure for zones
- Use LTF structure for entries
Example: Daily shows uptrend → 4H shows HL forming → 1H shows CHoCH bullish at HL → 15M gives entry trigger
Common Structure Mistakes
1. Marking every tiny swing
Not every wiggle is structure. Focus on significant swings that defined moves. Less is more.
2. Ignoring HTF
Your 15M CHoCH means little if daily is trending strongly against you.
3. Not waiting for confirmation
CHoCH is warning, not confirmation. Wait for new trend structure to form.
4. Using wick breaks as structure
Wicks test levels; bodies confirm breaks. A wick through doesn't change structure.
5. Fighting clear trends
"It has to reverse eventually" is how accounts die. Trade with structure until structure changes.
Practical Framework
Before each trading session:
- Check Daily/4H structure → Establish bias
- Identify where current structure levels are
- Note potential BOS/CHoCH levels
- Plan: "If price does X, I'll look for Y"
During session:
- Watch for structure events (BOS or CHoCH)
- At BOS: Continue bias, look for pullback entry
- At CHoCH: Pause, watch for new structure development
- Trade only with confirmed structure
FAQ
Q: How do I know which swings are significant? A: Significant swings create structure—they mark the start of moves that break previous structure. With practice, you'll develop pattern recognition.
Q: What timeframe should I use for structure? A: Match to your trading style. Day traders: 1H-4H. Swing traders: 4H-Daily. Use lower TF only for entries.
Q: Can structure be sideways (ranging)? A: Yes. When you see equal highs and equal lows (or roughly), market is ranging. Trade edges or wait for breakout.
Q: How many CHoCHs before reversal is confirmed? A: One CHoCH is warning. Look for BOS in the new direction (after new structure forms) for confirmation.
Conclusion
Market structure is the map of how price moves. HH/HL means buyers win. LL/LH means sellers win. BOS means the trend continues. CHoCH means change might be coming.
Master structure, and you'll know not just where price went—but who's in control.
Ready to see structure in action? Continue to Module 3: Market Structure or practice with our Structure Identification Exercises.
