Блог о Трейдинге
Реальные кейсы паттернов, анализ ловушек и обучающий контент из нашей системы тренировок.
Wick Refinement: Finding the True Origin of Every Move
The candle that caused a break isn't always obvious. The real origin — the demand or supply that powered the move — often hides inside a wick. Understanding wick refinement gives you tighter entries, smaller stops, and better risk-to-reward on every trade.
Why Your Demand Zone Melted: Understanding Zone Failure in Bearish Legs
You see a break of structure to the upside. You mark the demand. Price comes back and the demand melts like it never existed. The reason: you marked demand within a bearish internal structure leg.
Where CHoCH Matters: Why Higher Timeframe Zone Context Determines Everything
A change of character on the 15-minute chart means nothing in the middle of nowhere. But a 15m CHoCH inside a 4H demand zone? That's a high-probability reversal signal.
Supply and Demand Breaks: Why They Matter More Than Structure Breaks
Instead of asking 'did price break structure?', ask 'did price break supply or demand?' This single filter eliminates the majority of false signals and reveals which breaks have genuine institutional conviction.
POI Refinement: How to Narrow a Daily Zone to a 1-Minute Entry
A daily demand zone might be 200 pips wide. You can't trade that. But inside it, the 4H shows one candle that matters. The 15m reveals the liquidity event. The 1m pinpoints the exact entry. Here's the complete refinement workflow.
Liquidity POIs: Why Zones That Took Liquidity Are Significantly Stronger
Not all points of interest are equal. A zone that swept liquidity before forming has institutional fuel behind it — money was involved. A zone that formed in a vacuum might work, but it lacks the conviction that comes from a liquidity event. Here's how to tell the difference and why it matters for your entries.
Internal Structure vs Swing Structure: Why Most Breaks Don't Matter
Everything between two swing points is internal structure. Internal breaks of structure look like trend changes but are actually complex pullbacks within the larger leg. Understanding the difference between internal and swing structure prevents you from flipping bias on moves that are just noise.
Inducement vs Liquidity: Why Proximity to the Zone Matters
Every swing low has liquidity below it. But not every pool of liquidity counts as inducement for a specific zone. Inducement is close — it sits directly in front of the zone, gets swept, and the zone reacts immediately. General liquidity can be anywhere on the chart. The distinction changes how you assess zone quality.
Following Mitigations: The Chain That Reveals Where Money Lives
Price follows a pattern: take liquidity, mitigate to the left, repeat. Each step in the mitigation chain reveals where institutional orders entered and where price needs to go next.
Daily Session Review: Why Marking Up Charts When You Don't Trade Matters More
Most traders only review charts when they're in a trade. But the daily markup—even on days you don't trade—is what builds the pattern recognition, kills FOMO, and creates the abundance mindset that separates consistently profitable traders from everyone else.
Counter-Trend vs With-Trend: Why Your Management Strategy Should Change
Trading a pullback against the trend? Take profits at the nearest opposing zone. Trading with the trend? Let it run to the major target.
Zone Flips: When Supply Becomes Demand (and Vice Versa)
A zone flip occurs when a failed supply zone creates demand, or a failed demand zone creates supply. Learn how this order transfer creates high-probability trading zones.
Who Is In Control? How Supply and Demand Reveal Market Direction
Stop guessing the trend. When supply zones fail and demand holds, bulls are in control. When demand fails and supply holds, bears run the show.
How to Map Supply and Demand Zones: 3 Methods Every Trader Needs
Learn three proven methods to map supply and demand zones: candle bodies, wick refinement, and pivot wicks. Find the institutional footprints on any chart.
Supply and Demand Chains: How Orders Stack for Stronger Zones
When demand zones form in succession, orders transfer from one to the next. Learn how supply and demand chains work — and when too many chains signal a trap.
Structural Ranges: The Framework That Prevents Fake-Outs
Stop getting faked out by complex pullbacks. Structural ranges give you two clear levels: where the trend continues and where it reverses.
POI Selection: How to Choose High-Probability Supply and Demand Zones
Not all supply and demand zones are equal. Learn the four POI selection criteria — Extreme, Liquidity, Chain, and Zone Flip — that separate high-probability trades from noise.
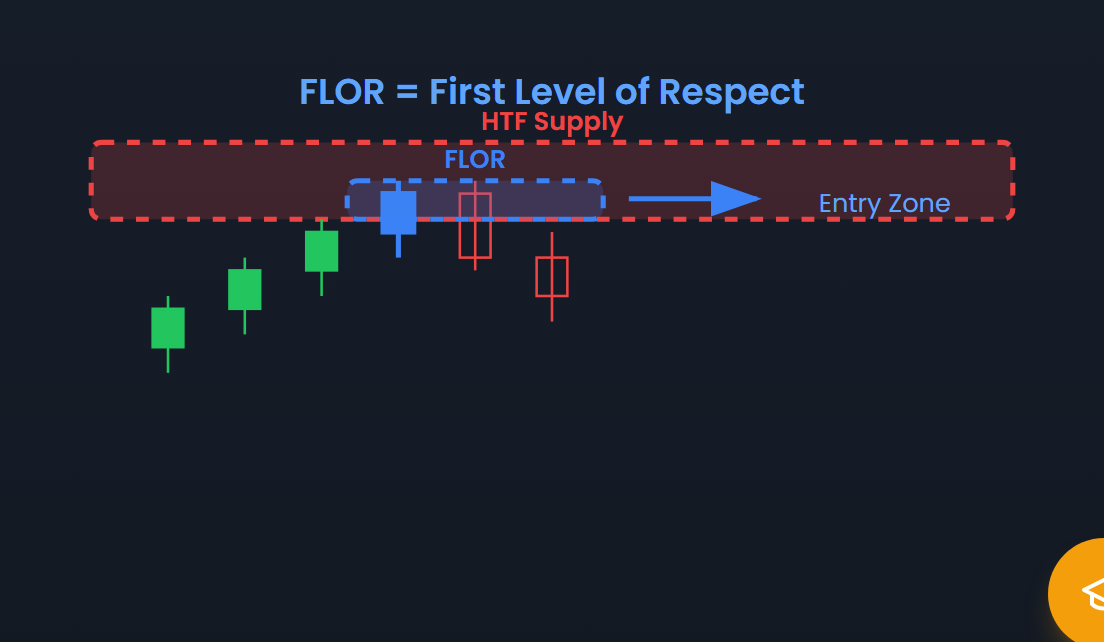
Order Flow Shifts: How the First Level of Respect Confirms a Reversal
A change of character isn't enough. The first level of respect — where the new side's zone actually holds — is what confirms the order flow shift.
The Multi-Timeframe Workflow: From 4H Bias to 1-Minute Execution
How to confirm a 4-hour supply or demand zone using 15-minute, 5-minute, and 1-minute order flow shifts. The complete top-down workflow for intraday trading.
Liquidity Sweeps: Structural vs Reactionary — How to Avoid Getting Trapped
Not all liquidity sweeps are the same. Structural sweeps target levels that broke other levels. Reactionary sweeps generate liquidity when the other side isn't in control.
Last Point of Control: The Final Confirmation of an Order Flow Shift
The first level of respect shows the new side can hold. The last point of control failing proves the old side is done. Together, they confirm real reversals.
Internal vs External Range Liquidity: Where the Market Gets Its Fuel
The market doesn't move randomly — it targets liquidity. Internal range liquidity fuels pullbacks. External range liquidity fuels impulsive legs. Here's how both work.
Impulsive vs Corrective Price Action: How to Read the Market Phase
Large-bodied candles with momentum are impulsive. Choppy, wicky candles are corrective. Knowing the difference determines whether you trade with the trend or against it.
How to Map Market Structure: A Step-by-Step Guide
Stop guessing where the trend is going. Learn a systematic approach to mapping highs, lows, breaks of structure, and structural ranges on any chart.
How to Confirm a Break of Structure: The Hard Close Candle Method
A wick above resistance isn't a break of structure. Learn the Hard Close method to filter fake breakouts and confirm real structural breaks.
Expectation Order Flow: How to Trade with the Market's Direction
If highs are failing and demand is holding, the market is bullish. If lows are failing and supply is holding, the market is bearish. Learn how expectation order flow keeps you on the right side.
Early Enticement: Why the Market Builds Traps Before the Real Move
No liquidity to the left? The market builds it to the right. Pre-interaction, reactionary, and post-interaction enticement — the three traps that catch early traders.
Complex Pullbacks Explained: Why Most Traders Get Trapped in Corrections
A complex pullback creates internal market structure that looks like a trend change. Learn how structural ranges prevent you from getting faked out.
Window of Imbalance: A Context Tool, Not an Entry Signal
The window of imbalance (fair value gap) shows where price moved so fast that it left an inefficiency. Many traders try to enter trades directly from these windows. That's a mistake. The window of imbalance is a context tool that tells you where price might react — but the extreme of the zone might never get hit.
Break vs Sweep: How to Tell If Structure Is Breaking or Getting Swept
When a high or low gets taken out, is it a genuine break or a liquidity sweep? Learn the order flow rules that tell you the difference before it's too late.

Change of Character (ChoCh): Der ultimative Guide zu Trend Reversals
Lerne, wie du Change of Character (ChoCh) erkennst und Trendumkehrungen bestätigst. Mit der Zwei-Bruch-Regel zu höherer Trefferquote.
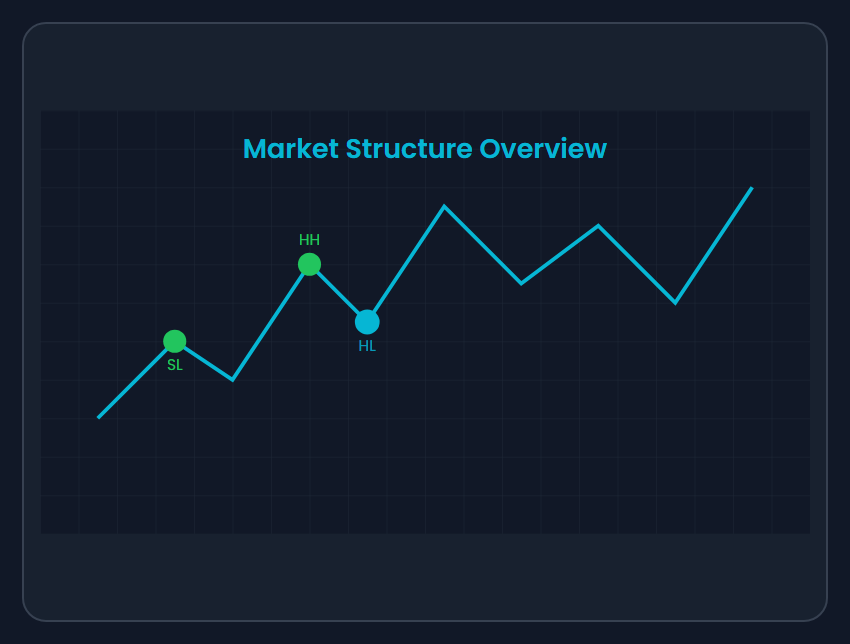
Market Structure: How to Read Trends, Reversals, and Structure Breaks
Master Higher Highs, Higher Lows, Break of Structure (BOS), and Change of Character (CHoCH). The foundation of professional price action trading.

Candlestick Patterns for Beginners: Reading the Language of Price
Learn essential candlestick patterns from doji to engulfing. Understand what each candle tells you about buyers, sellers, and market momentum.

Trading Psychology: Mastering the Mental Game of Trading
Conquer fear, greed, FOMO, and revenge trading. Learn practical strategies to build discipline and develop a professional trader's mindset.

Supply and Demand Zones: Finding Where Institutions Trade
Master the art of identifying high-probability supply and demand zones. Learn zone quality criteria, entry techniques, and common mistakes to avoid.

Liquidity Sweeps: How Smart Money Hunts Your Stop Losses
Learn how institutional traders use liquidity sweeps to enter positions. Master stop hunt recognition and turn these moves into trading opportunities.

Reading Order Flow Through Candlesticks: A Visual Guide
Learn to read buying and selling pressure directly from candlesticks without indicators. Understand momentum, volume, and market control through pure price action.

Risk Management in Trading: The Complete Guide to Protecting Your Capital
Master position sizing, risk-to-reward ratios, and drawdown management. Learn why risk management is the difference between amateur and professional traders.
The 2 Phases of the Market: Impulsive vs Pullback
Learn to identify the two fundamental phases of market movement - impulsive expansions and pullback corrections - to trade with the trend.
Market Sessions: Understanding When to Trade for Maximum Success
Learn about the London, New York, and Asia trading sessions - when markets are most active, how sessions interact, and the best times to trade.
Entry Models & Liquidity: A Complete Guide
Learn about entry models & liquidity - key concepts, how to identify them, and practical trading applications.
Market Structure - Trend Basics: A Complete Guide
Learn about market structure - trend basics - key concepts, how to identify them, and practical trading applications.
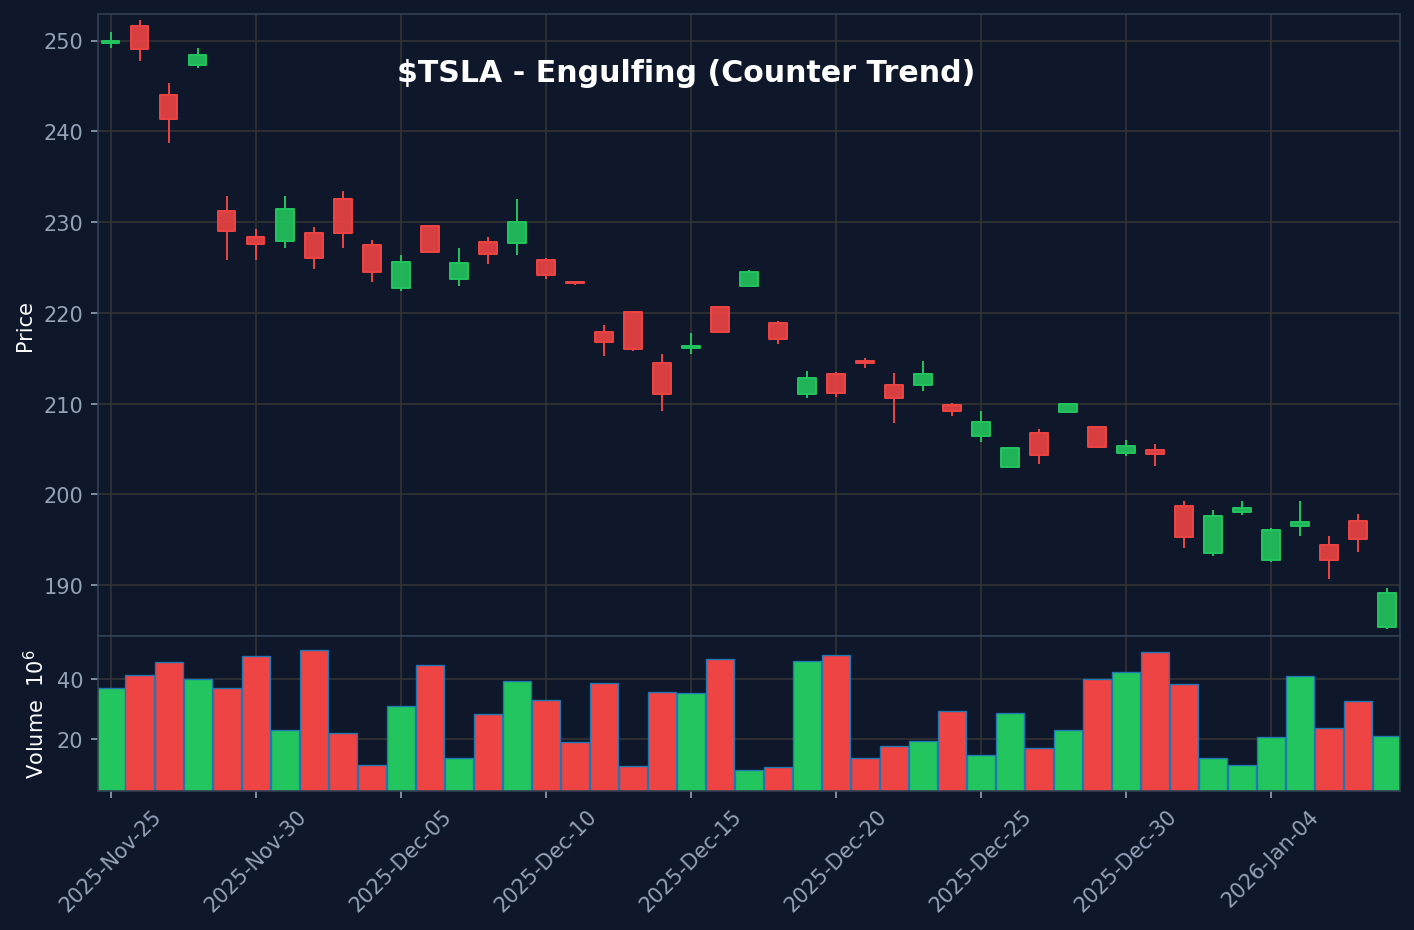
Engulfing on $TSLA: When the Best Trade is No Trade
Not every Engulfing is tradeable. Learn when to pass on setups like this $TSLA example that went against the trend.
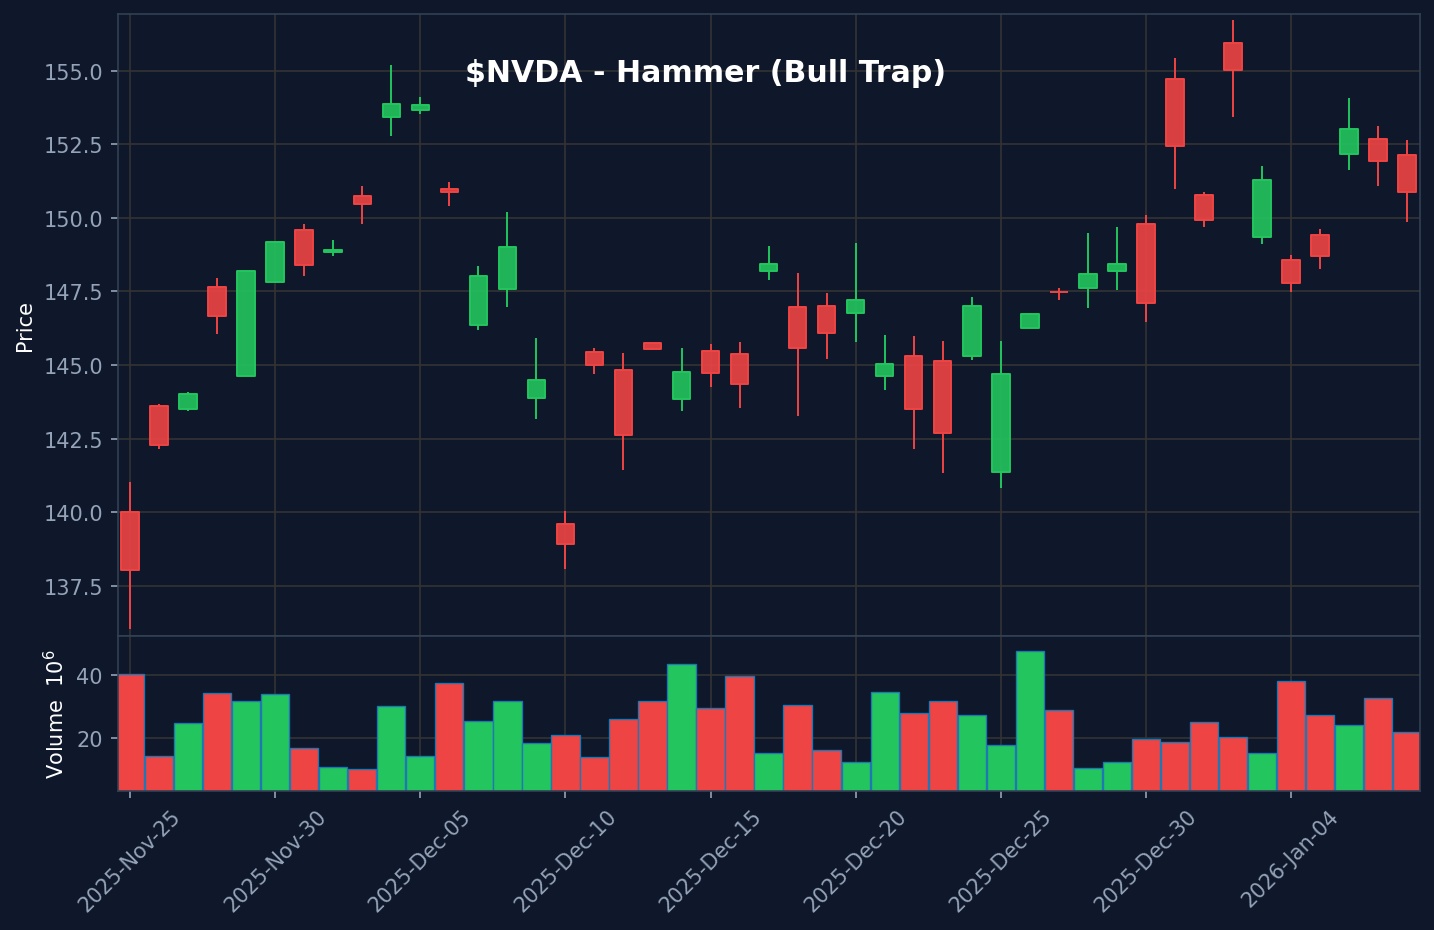
Hammer Bull Trap on $NVDA: A Failed Breakout Lesson
Learn how to spot a bull trap in Hammer patterns. Real $NVDA example showing warning signs and how to avoid counter-trend traps.
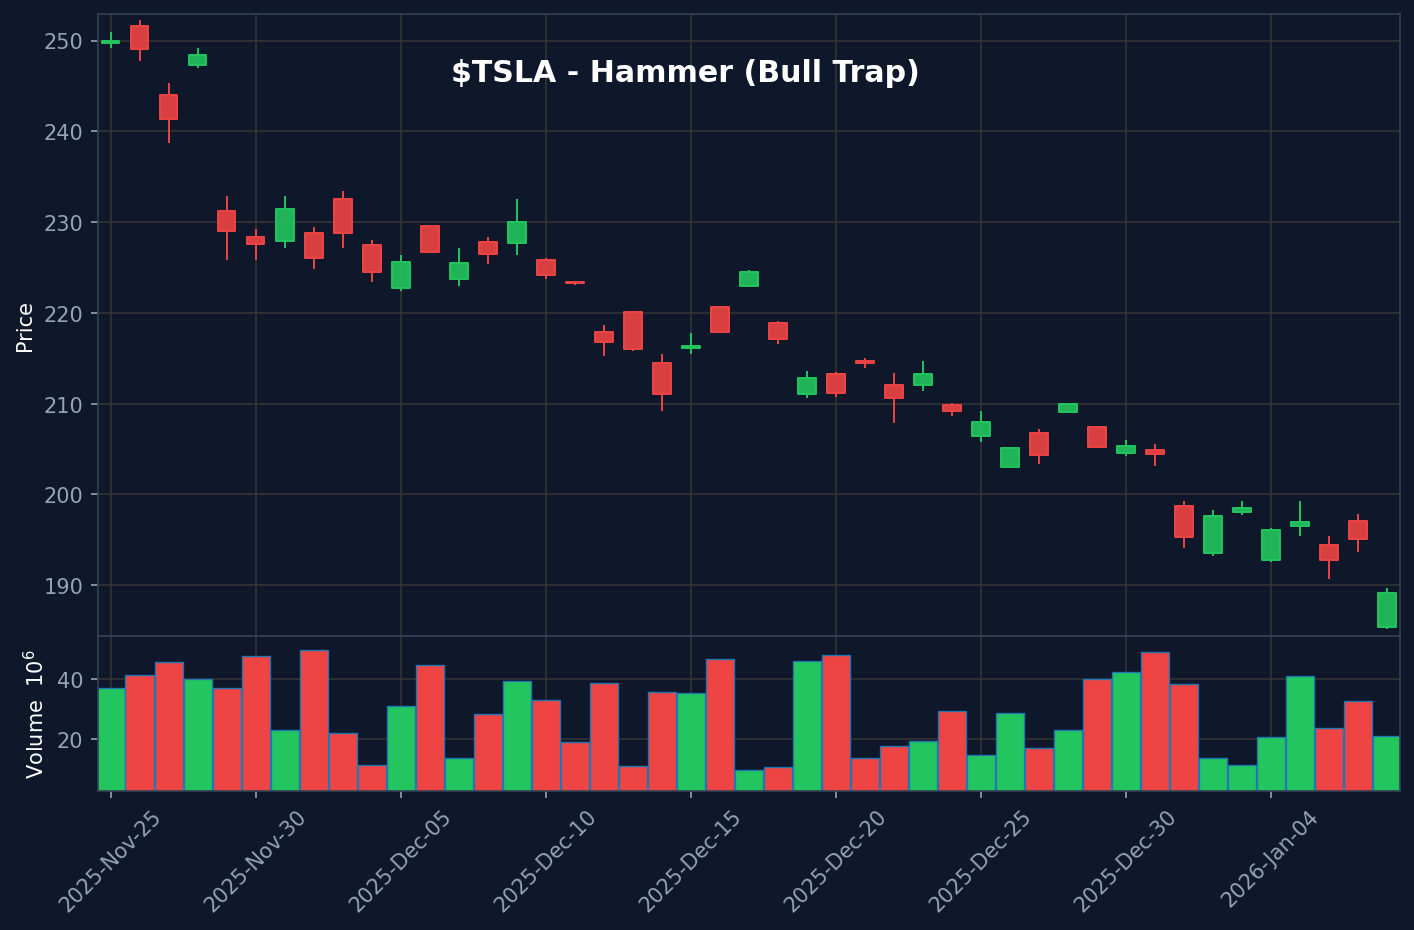
Hammer Bull Trap on $TSLA: A Failed Breakout Lesson
Learn how to spot a bull trap in Hammer patterns. Real $TSLA example showing warning signs and how to avoid counter-trend traps.
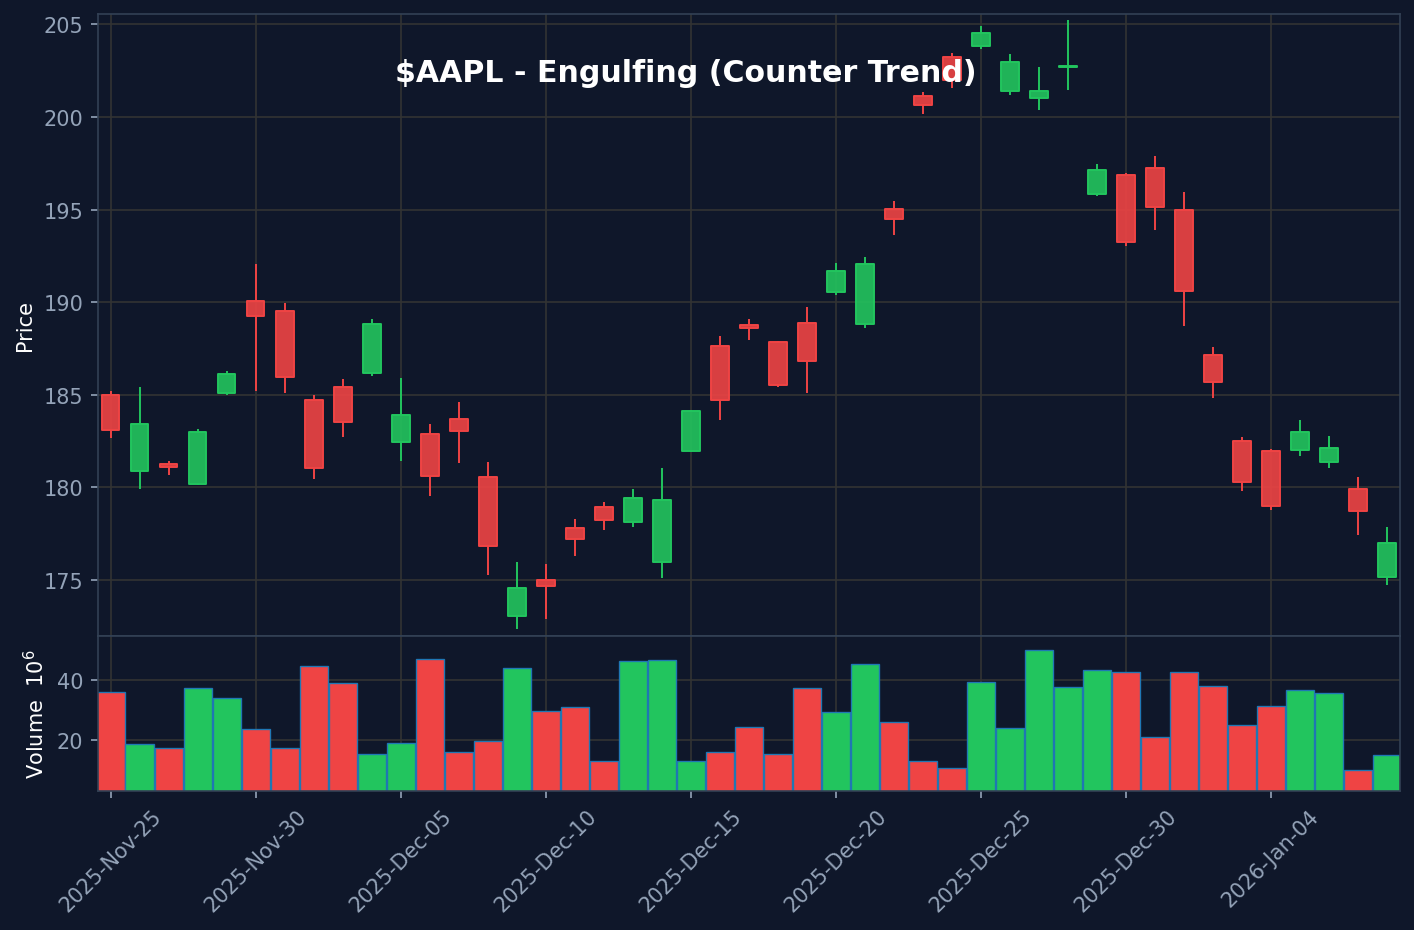
Engulfing on $AAPL: When the Best Trade is No Trade
Not every Engulfing is tradeable. Learn when to pass on setups like this $AAPL example that went against the trend.